Every time I open a stock site, the same thought hits me.
"More features than ever — so why am I more tired?"
Yahoo Finance, TradingView, Investing.com, Bloomberg, Robinhood — each is a great tool. Yet every year more features get added, screens get more crowded, and navigation gets trickier. Meanwhile, simple questions like "Among the top 100 stocks by market cap, who's the biggest gainer today?" only get harder to answer.
Information is plentiful. The real problem is that there's too much of it — and, for non-US markets, often not the right kind. Korean stock data on global platforms is frequently delayed, incomplete, or routed through third-party aggregators that introduce errors.
1. Are More Features Always Better?
What I really wanted was simple — readability, easy controls, only the essentials.
- ✓Korea & US on one screen — converted to the same currency, so I can instantly see where a Korean stock stands globally and how the two markets compare in size.
- ✓Re-rank by any metric I want — pick from 30 metrics like PER, ROE, or dividend yield, and see top/bottom performers at a glance in one table.
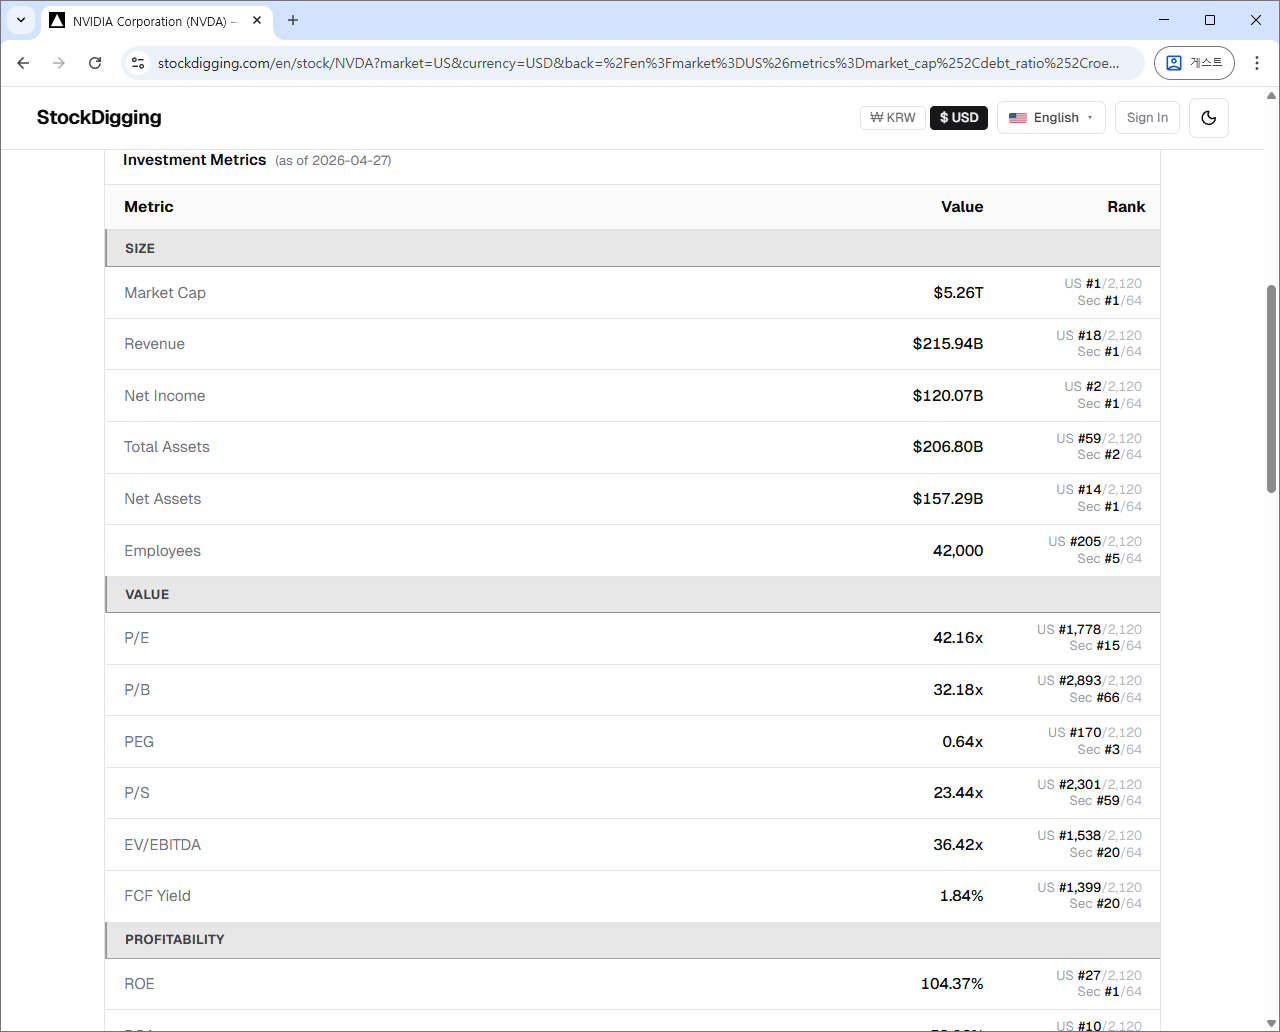
- ✓10-year financial history + each metric's rank in stock detail — including overall market and same-industry rankings. 30 metrics total.
- ✓Side-by-side comparison of 2–5 stocks — cumulative return chart and metric-by-metric winners in one view.
- ✓Overlay price with indices, FX, and rates — see market and macro impact on a single chart.
Why is this kind of basic functionality so hard to find? Probably because, a tool that tries to serve everyone serves no one.
So I built it myself. The philosophy is simple.
2. The 8 Differences That Define StockDigging
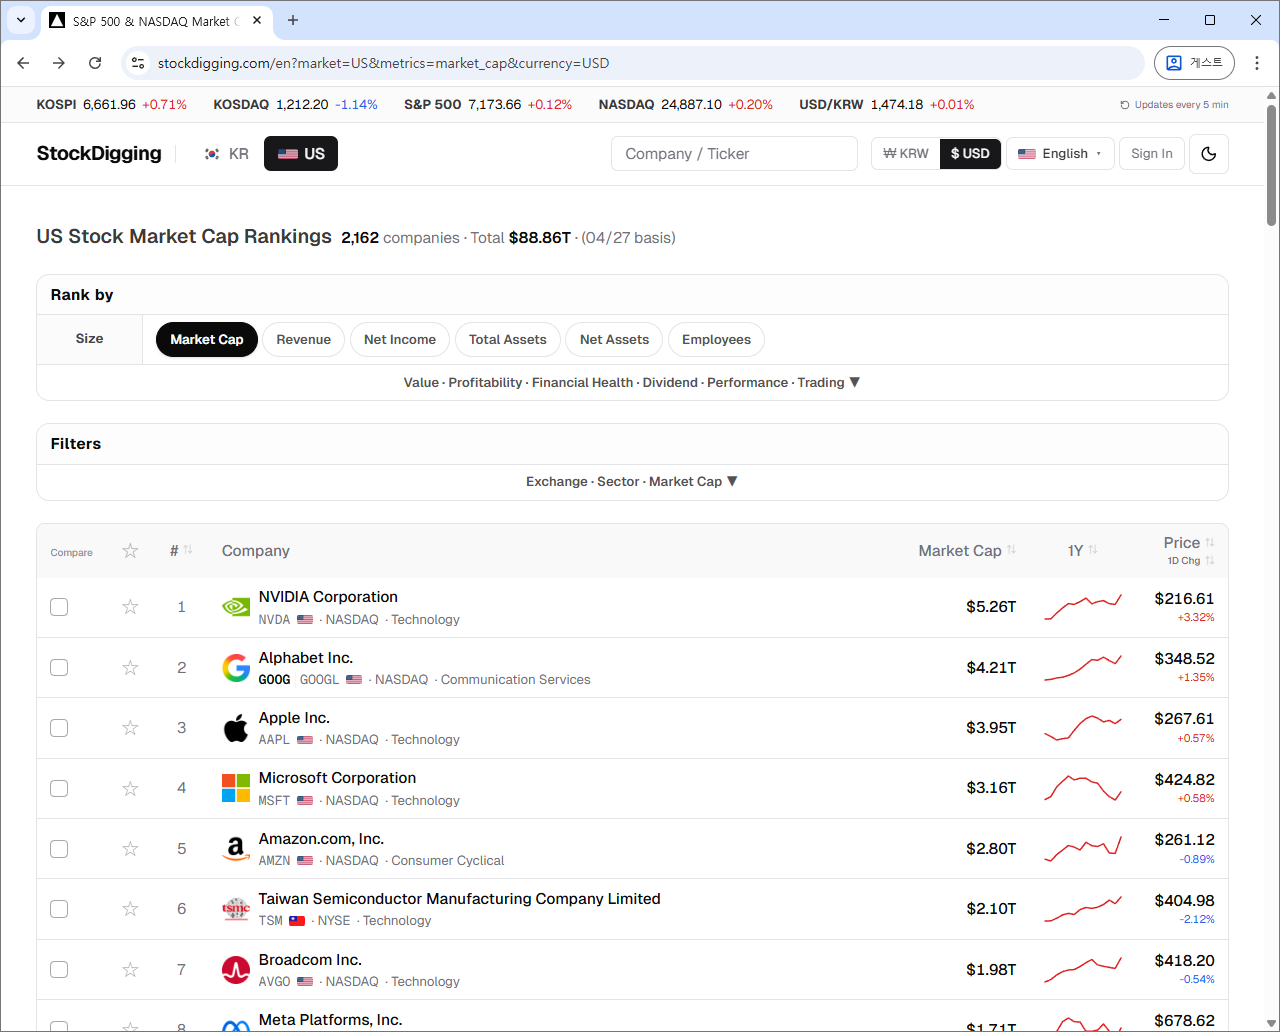
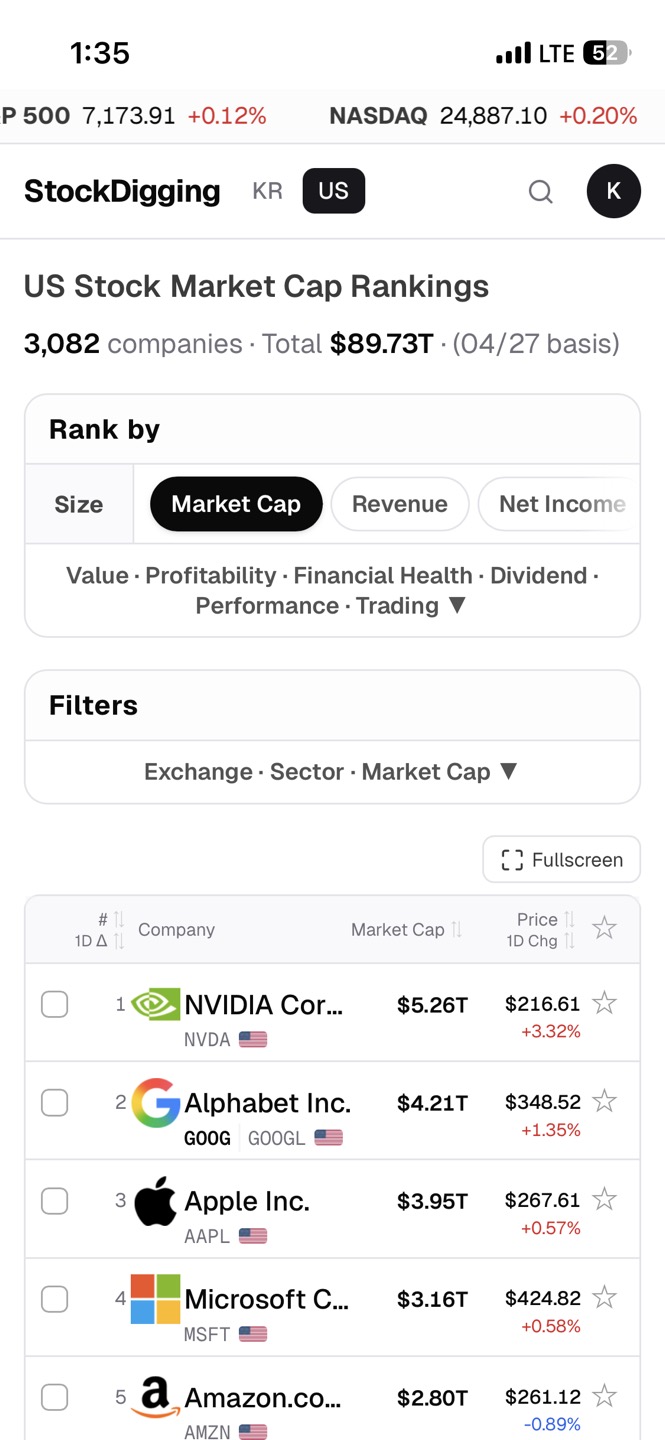
2-1. Everything Fits on One Screen
Open the page and it's all there: sort options, filters, stock list. That's it. No popups, banner ads, or notification toasts.
Sort metrics are organized into 7 categories (Size · Value · Profitability · Financial Health · Dividend · Performance · Trading) as clickable chips. One click switches the ranking from market cap → PER → ROE — in under a second.
2-2. Just the Information You Need, Pinpointed
Most stock sites pile on 50–100 metrics. In practice, only 5–10 ever inform real decisions. StockDigging gives you the 30 essentials, nothing more.
- ✓Size — Market Cap, Revenue, Net Income, Total Assets, Net Assets, Employees
- ✓Value — PER, PBR, PEG, PSR, FCF Yield, EV/EBITDA
- ✓Profitability — ROE, Operating Margin, Revenue Growth
- ✓Financial Health — Debt Ratio, Net Debt/EBITDA, Total Debt, Cash on Hand, Current Ratio
- ✓Dividend — Dividend Yield, Dividend Growth
- ✓Performance — 1Y Return, 30D Return, 1D Change, % from 52W High, MDD
- ✓Trading — Volume, Trading Value
Metrics get added based on user requests. Tell me what's missing.
2-3. DART & FMP Source Data — Built on Trust
StockDigging doesn't use second-hand aggregated data.
- ✓Korean stocks — DART (Korea's official corporate disclosure system, the legal source of truth for every Korean listed company)
- ✓US stocks — FMP (Financial Modeling Prep) primary source
This matters especially for Korean stocks. Most US-based platforms either don't cover KOSPI/KOSDAQ at all, cover only a handful of large caps, or pull from unofficial mirrors that lag the official filings. StockDigging gives English-speaking investors the same data Korean institutional investors actually use, with the full Korean universe (KOSPI + KOSDAQ, ~2,400 names) instead of a curated slice.
Metrics like PER and market cap are recalculated daily from the closing price. No stale snapshots — you see today's number reflecting today's market close.
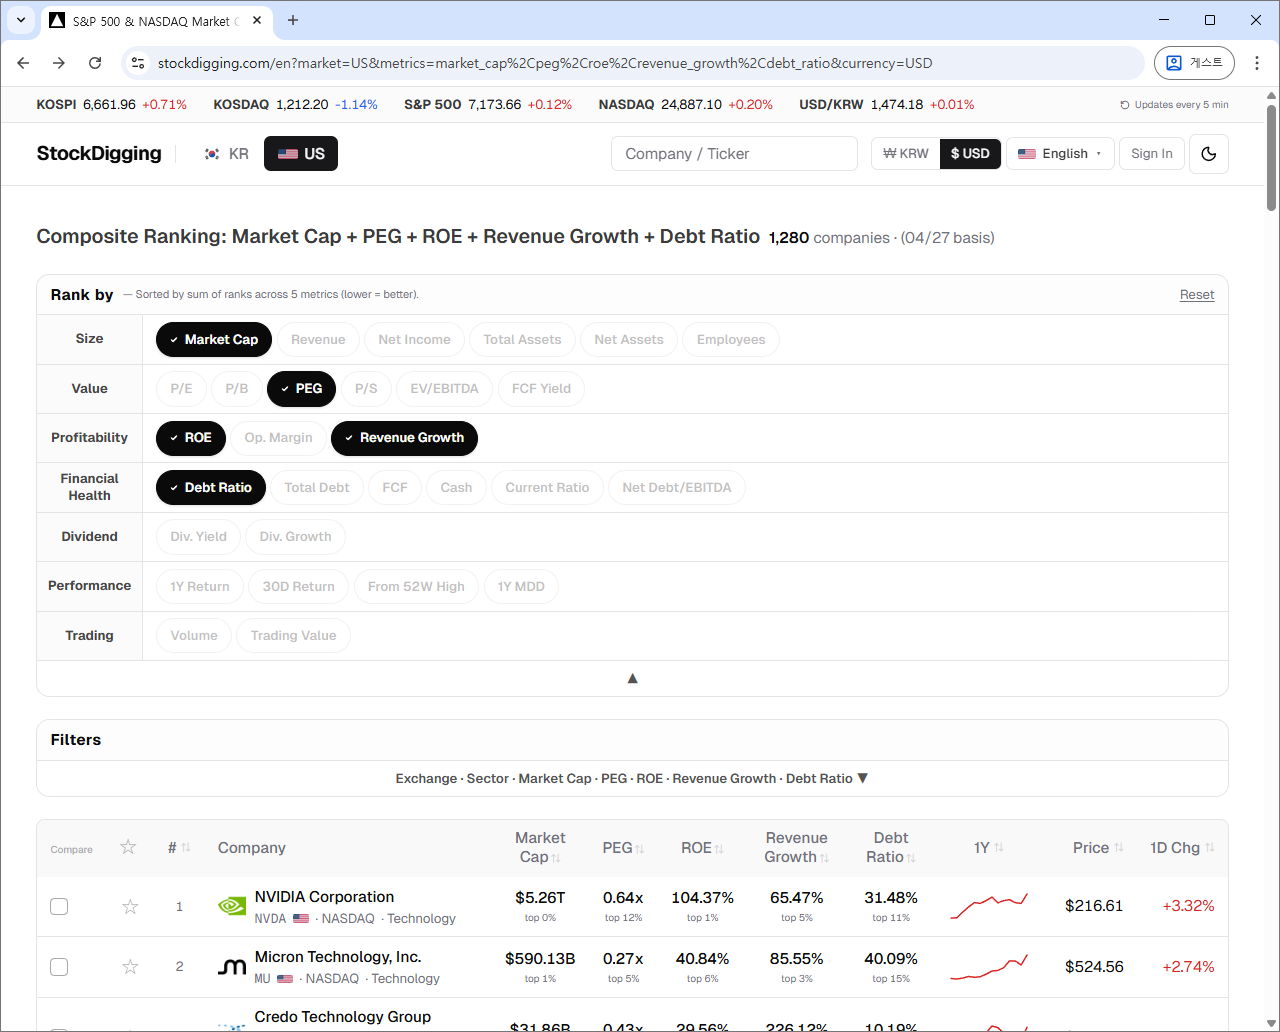
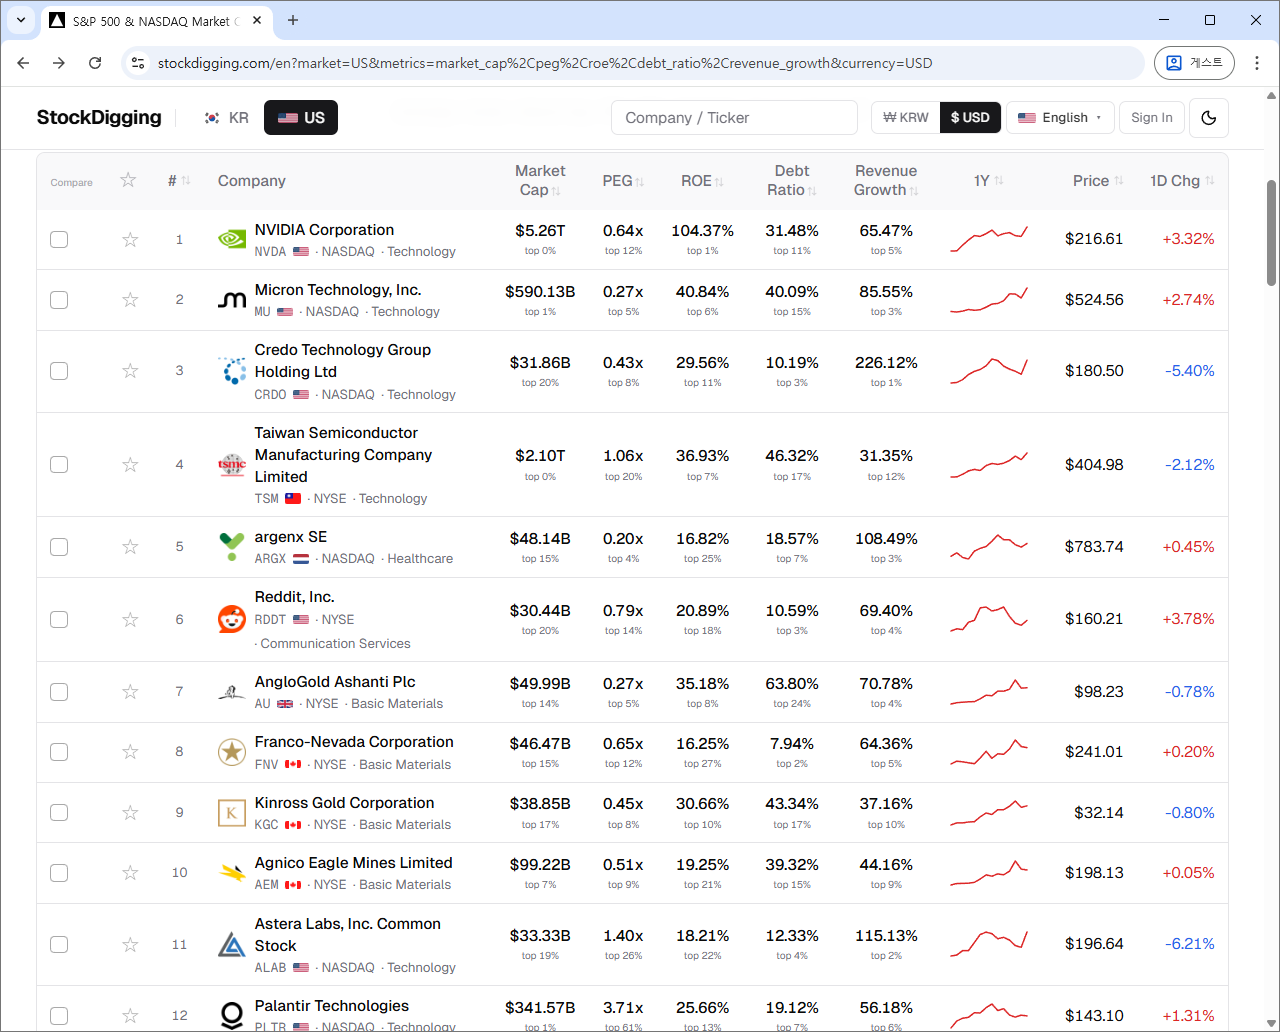
2-4. Composite Ranking — In One Click
"A high-quality, undervalued company that's also growing" — finding stocks that satisfy all three usually means opening multiple sites and combining lists in your head. StockDigging's Composite Ranking answers this in under a second.
Pick 2–5 of the 30 metrics, and stocks are sorted by their combined rank. For the example above:
- ✓ROE — capital efficiency (higher = quality)
- ✓PER — valuation (lower = undervalued)
- ✓Revenue Growth — growth (higher = growing)
Pick all three, and the combined ranking is generated automatically. Other sites force you to look at each separately and combine them mentally.
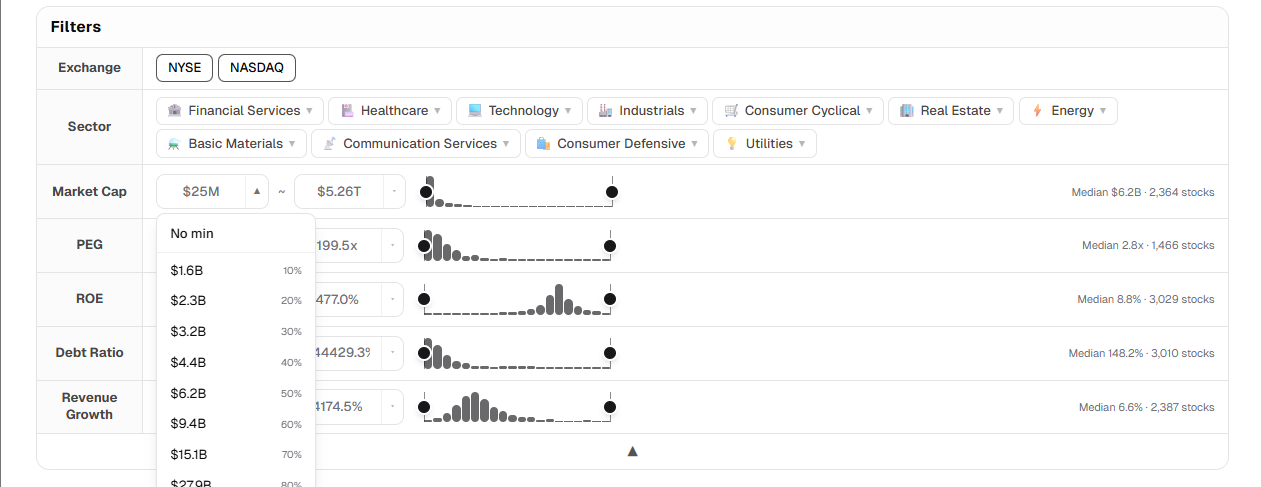
2-5. Range Filter — With Distribution at a Glance
Once you've narrowed candidates with composite ranking, the next step is filtering by detail. StockDigging's range filter isn't just a min/max input box.
Each metric shows a distribution histogram right next to it. You see how market cap, PER, or ROE actually distribute across the market, so you can immediately tell:
- ✓Where the market average PER sits
- ✓How narrow or wide your current range is
- ✓Where the outliers are
With this context you can set filters by relative position to the whole market, not just abstract numbers.
Controls are flexible:
- ✓Direct input — when you need an exact value
- ✓Slider drag — intuitive range adjustment
- ✓Dropdown presets — common ranges in one click
2-6. Stock Comparison — From Candidates to Final Picks
Once you've narrowed candidates with composite ranking, the next step is side-by-side comparison. Pick 2–5 stocks, and the winning value for each metric is shown in bold.
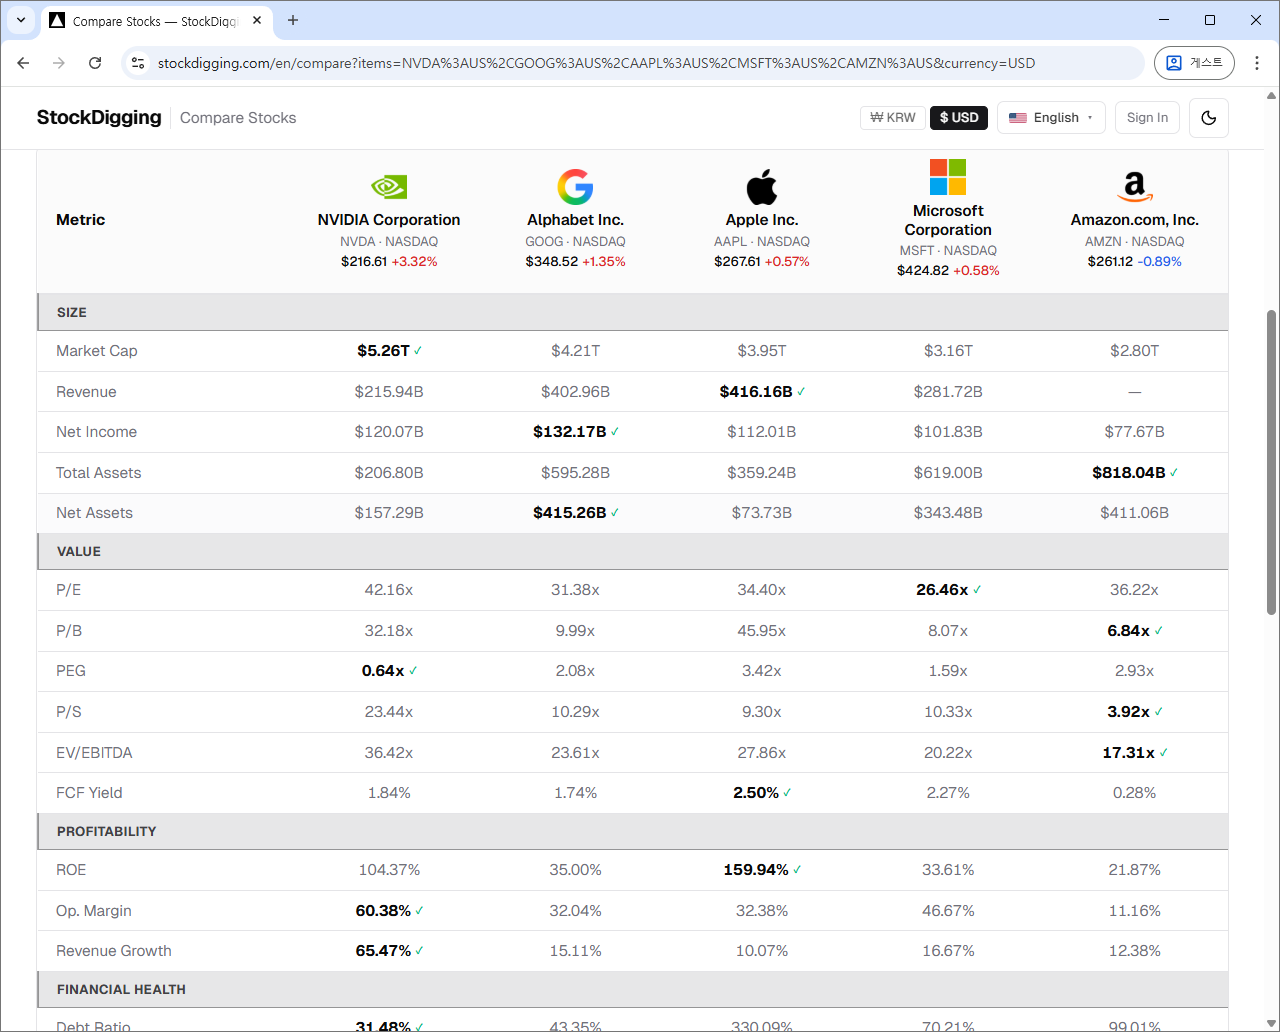
And there are two especially powerful features.
① Cumulative Return Chart
All selected stocks are aligned to a 0% baseline over the past year. How NVIDIA and Intel diverged over the last 12 months — instantly visible. It's relative return, not absolute price, so stocks at very different price levels still compare fairly.
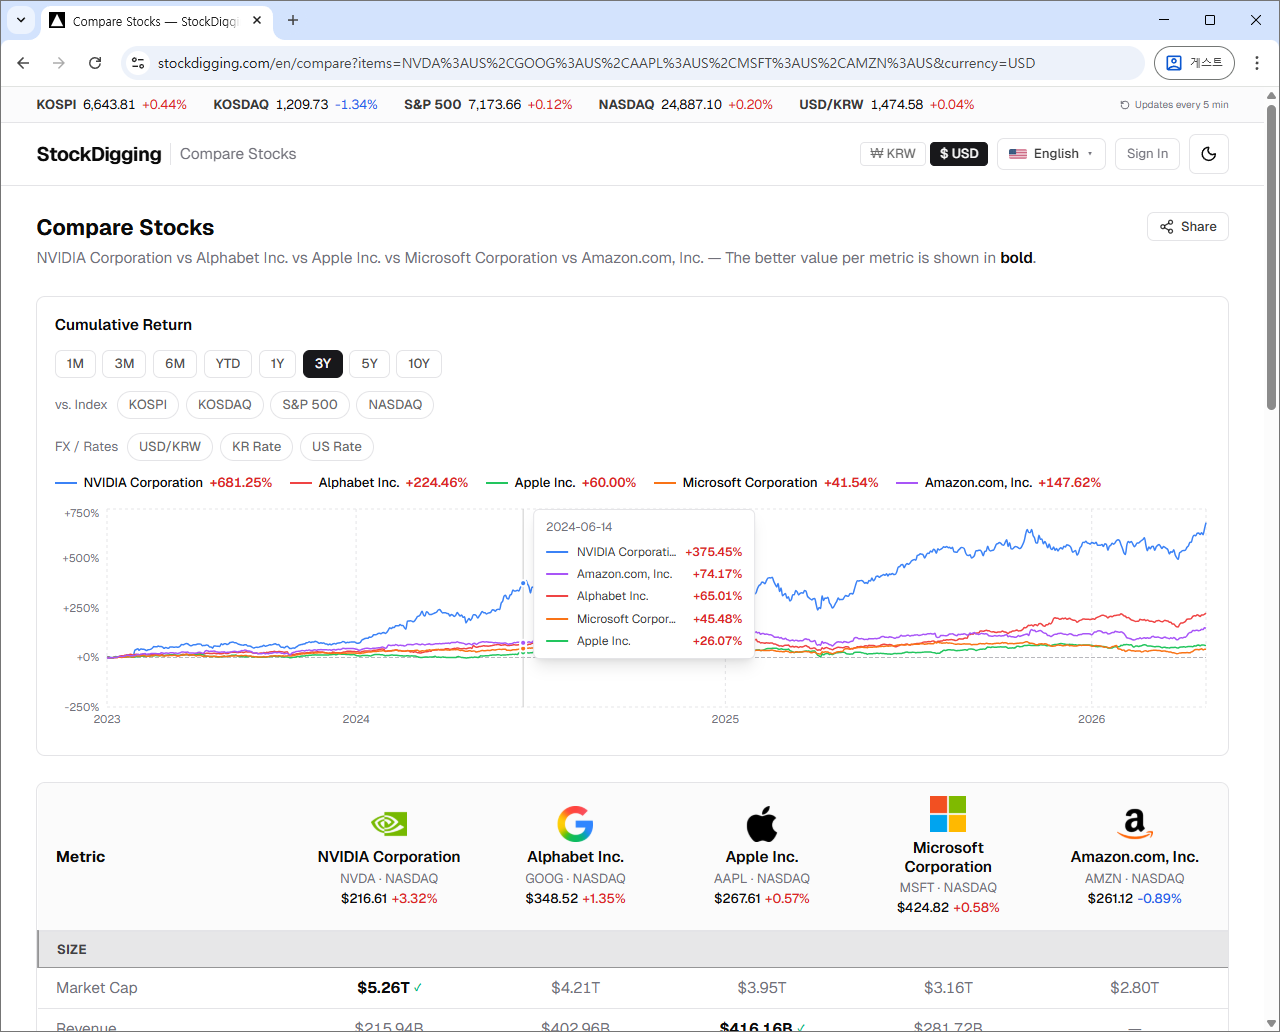
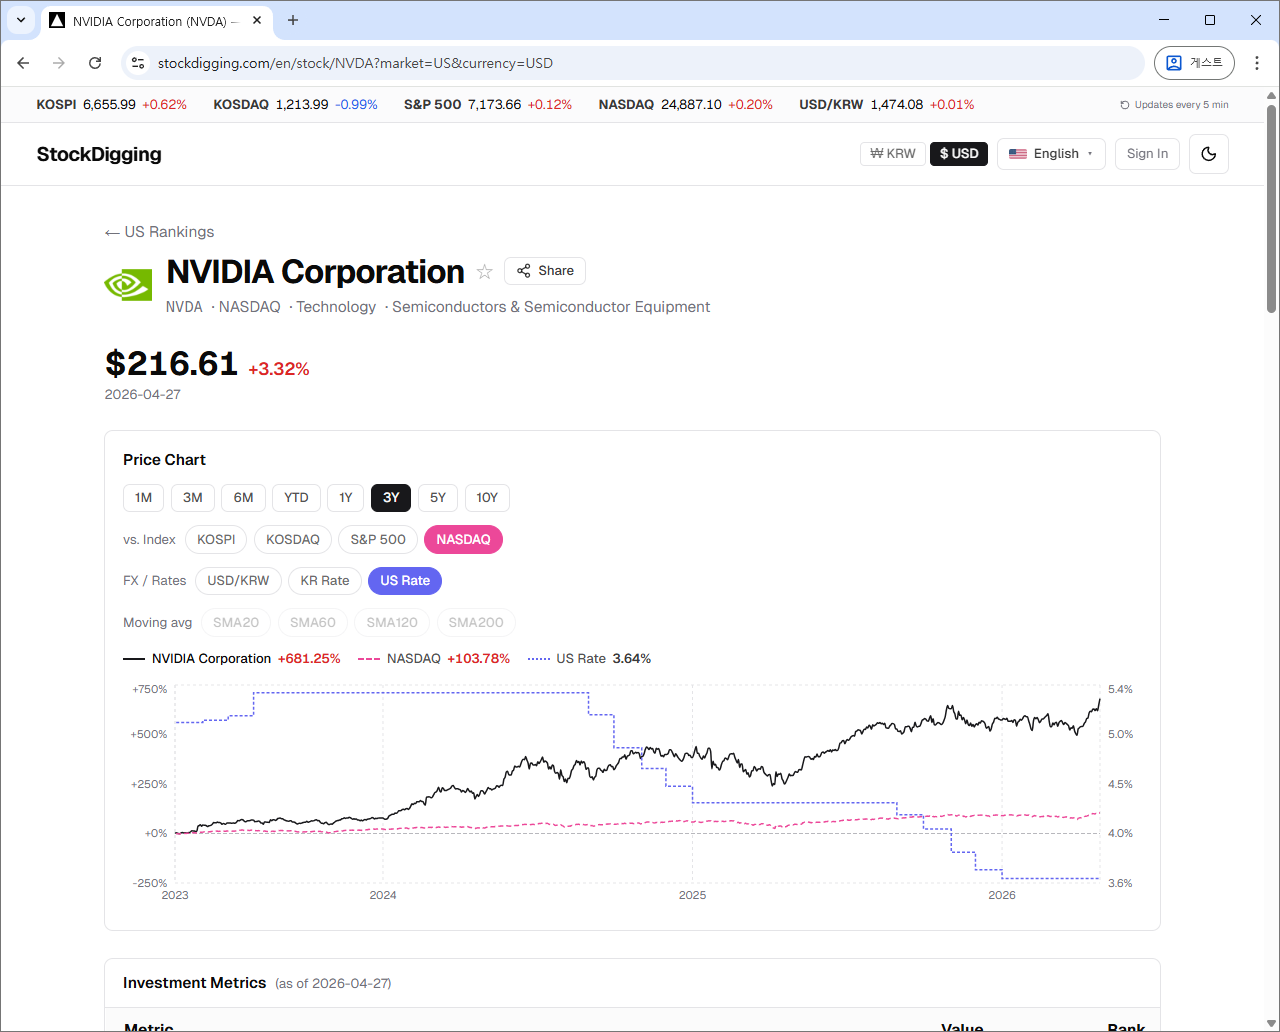
② Compare with Indices, FX, and Rates
On the stock detail page, you can overlay a stock's price chart with macro indicators:
- ✓Market indices— KOSPI · KOSDAQ · S&P 500 · NASDAQ
- ✓FX rate — USD/KRW
- ✓Interest rates — Korea base rate · US base rate
How much does this stock move with the market (beta · alpha)? How does dollar strength affect Korean exporters? How did growth stocks react when the Fed hiked rates? — One chart and the answer is right there.
The same overlay also works on the comparison page — multiple stocks and macro indicators in one chart.
All charts can be zoomed and panned by drag, and on mobile a fullscreen button opens the full chart in landscape.
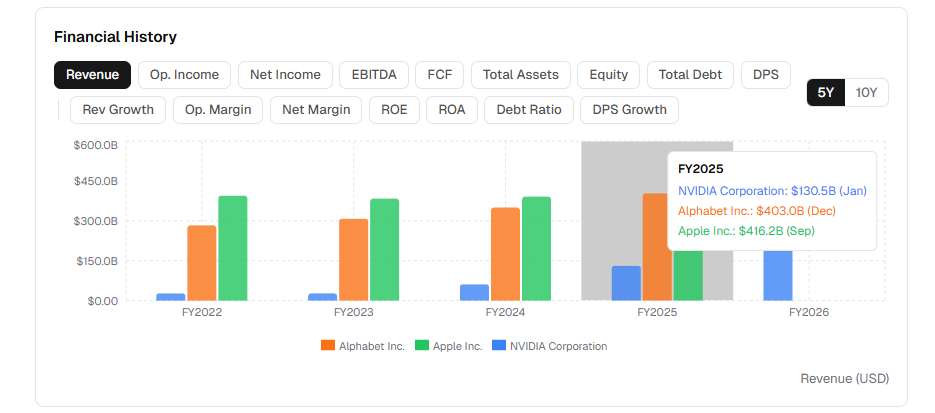
2-7. Financial History — 10 Years at a Glance
A single quarter's numbers can mislead. A stock that looks strong this quarter can tell a very different story when you look at ten years of trend.
StockDigging's financial history chart shows up to 10 years of annual data as a bar chart. Revenue, operating income, net income, EBITDA, FCF, total assets, equity, total debt — 16 metrics, each switchable with one click. Toggle between 5Y and 10Y view freely.
A company with seven straight years of flat revenue but rising debt is a different animal from one with steady FCF growth — even if this quarter's EPS looks identical. The bar chart makes that obvious immediately.
On the comparison page, this same financial timeline works across multiple stocks simultaneously. Once you've narrowed your candidates, compare NVIDIA vs Apple vs Microsoft revenue side by side — and see things that price charts alone can't show.
2-8. Watchlist — All Your Discoveries in One Place
Stocks you found while reading a thread, top hits in a composite ranking, or finalists from your comparison — no need to track them down again. One ⭐ click next to a stock name adds it to your watchlist.
- ✓One-click sign-in with Google
- ✓Auto-sync across devices — star a stock on your phone, see it on your PC instantly
- ✓Daily updates at close — track movements at a glance
No more keeping ticker codes in a notes app.
3. What We Don't Do
StockDigging does none of these:
- ✓No price targets — no "this stock should be worth $X" claims
- ✓No buy / sell recommendations — no "buy now" or "hold today" advice
- ✓No data-blocking ads — the screen is designed so the data stays visible
- ✓No subscriptions, no payments — every feature is free
Instead, you get fully objective data. Which stock to buy, when to buy, at what price — every judgment is yours alone.
4. Who Is This For?
- ✓US stock investors curious about Korea — looking for accurate KOSPI/KOSDAQ data with English UI, instead of fragmented coverage on global platforms
- ✓Investors tracking Korean equities seriously — same DART-sourced data Korean institutions use, with the full ~2,400-name universe
- ✓Anyone who'd rather judge from data than from opinions — no price targets, no recommendations, just the numbers
- ✓You want a clean screen, not buried in ads — and a smooth mobile experience for the commute
5. Try It Yourself
The best way to know is to try it. Search for a stock you've been curious about, or browse the market cap rankings. It's free, and most features work without signing up. (A quick login is only needed for personal features like the watchlist.)
Got feedback, feature requests, or a metric you'd like added? Let me know. Foreign Ownership Ratio, for example, came from a user request.