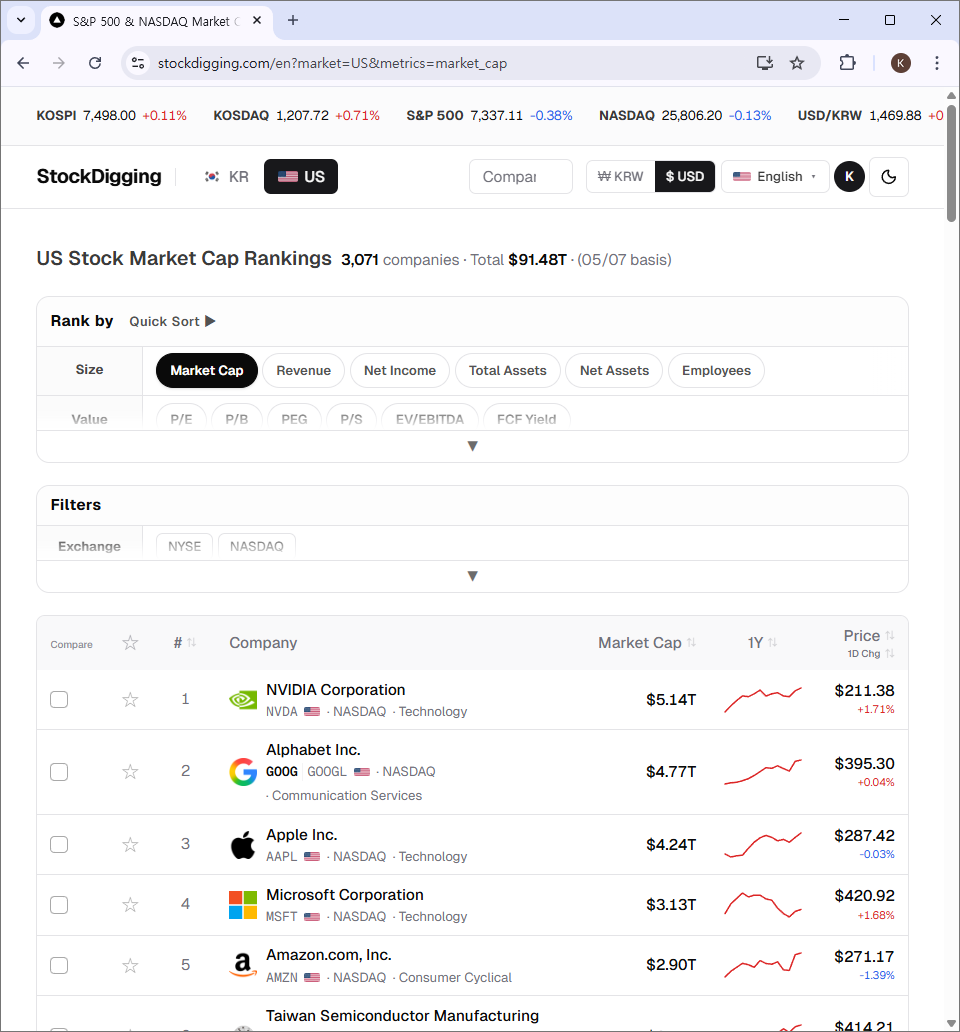
The US top 5 by market cap, side by side
NVIDIA, Alphabet, Apple, Microsoft, Amazon — the five most valuable companies on the US stock market. Their combined market cap is roughly $20 trillion. We all "know" these companies, but lay key metrics side by side and the numbers tell a different story than the headlines.
1-year returns — Alphabet +159%, Microsoft the only one in the red
We start every stock at the same baseline (0%) and chart the cumulative return over the past year.
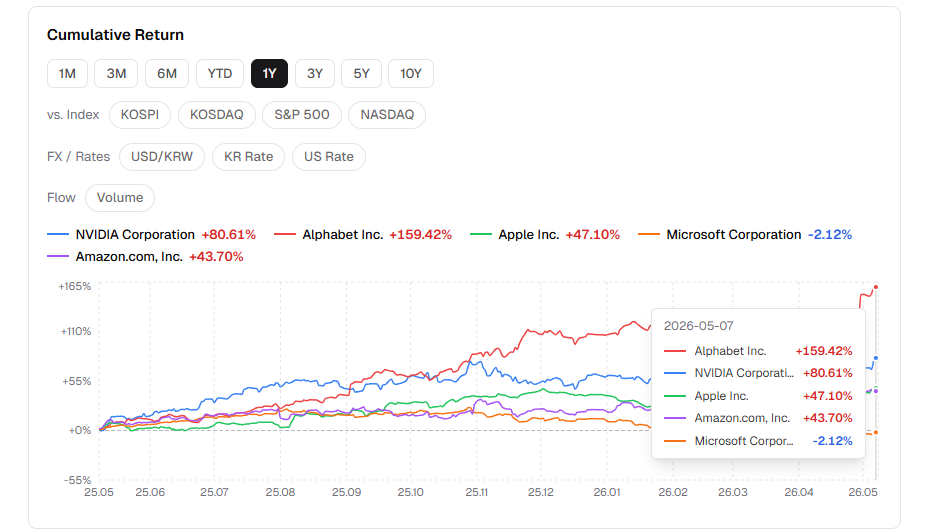
The standout is Alphabet at +159.42%. Long dismissed as falling behind in AI search and cloud, Google ended up topping this group — driven by Gemini's improvements and a recovery in YouTube and ad revenue.
At the other end, Microsoft at -2.12% is the only stock in the group that lost ground over the year. The market's read: Azure growth post-Copilot fell short of expectations. NVIDIA's +80.61% is still excellent in absolute terms, but it's only second place here.
One thing worth pausing on: these are companies with market caps of $3T–$5T each. A $100B company posting +80% in a year would be front-page news. The most-followed, most-institutionally-held companies in the world delivered these returns in a single year. 2025 was clearly not an ordinary year.
Size and value — the most valuable company has the smallest revenue
The metrics table compares all 31 indicators across categories. The best value in each row gets a ✓.
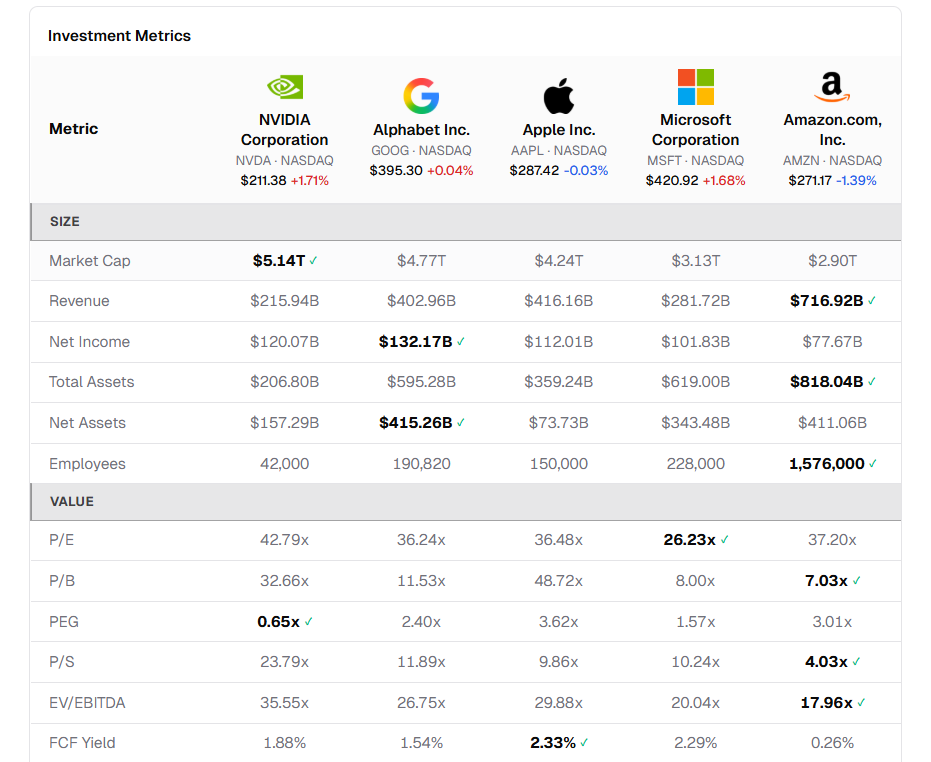
On size, there's an interesting paradox. NVIDIA leads market cap at $5.14T, but its revenue of $215.94B is the lowest of the five. Revenue is led by Amazon ($716.92B), total assets also Amazon ($818.04B), and headcount also Amazon (1.57 million). Amazon sweeps all three "scale" metrics — yet its market cap of $2.90T is the smallest of the five. A textbook case of "biggest company ≠ most valuable company."
On valuation, PEG stands out. NVIDIA's PEG of 0.65x is the lowest in the group. P/E alone (42.79x) looks expensive, but factoring in 65% revenue growth, it's actually the cheapest on a growth-adjusted basis. On raw P/E, Microsoft at 26.23x is the cheapest.
Profitability and financial health
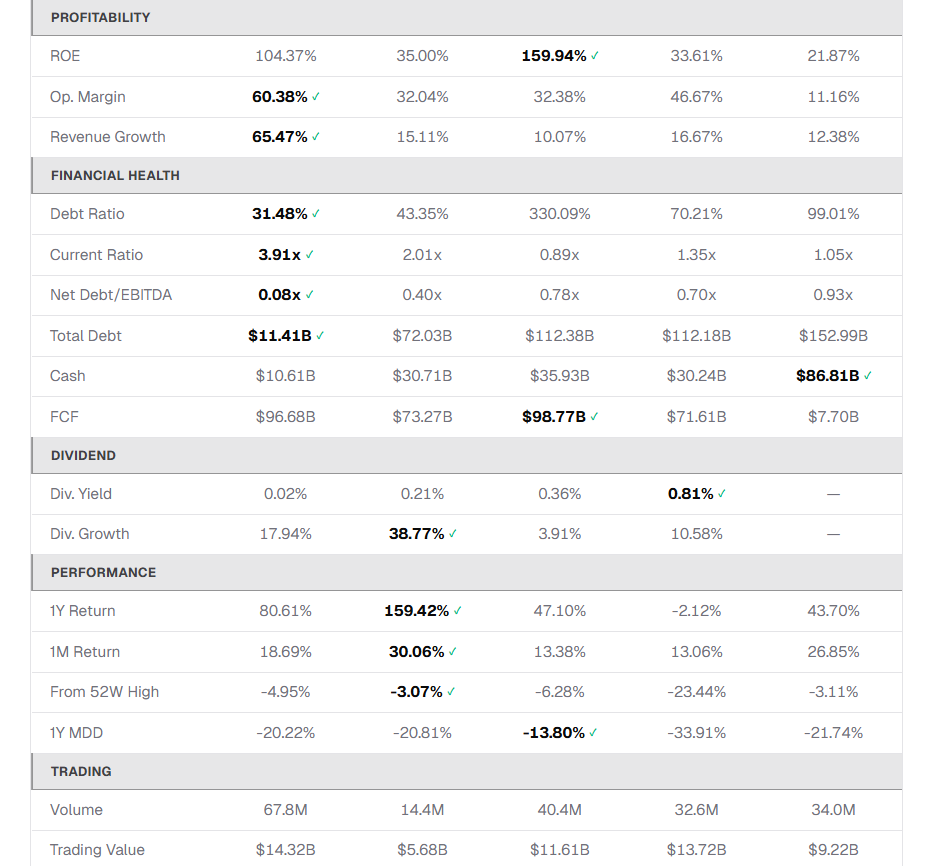
On profitability, ROE is led by Apple at 159.94% — higher than NVIDIA's 104.37%. The reason: decades of buybacks have driven Apple's book equity to extremely low levels, mechanically inflating ROE. On operating margin and revenue growth, NVIDIA dominates with 60.38% and 65.47% respectively.
On financial health, Apple's debt ratio of 330% is by far the highest. That's not a warning sign — Apple generates $98.77B in annual FCF and uses that cash for ongoing buybacks. Leverage here is a deliberate strategy, not a weakness. NVIDIA, by contrast, has a debt ratio of 31.48% and net debt/EBITDA of 0.08x — the cleanest balance sheet in the group.
On dividends, Microsoft leads with a yield of 0.81%, and Alphabet's dividend growth of 38.77% is the highest. Amazon doesn't pay one. Big tech yields are structurally low for a reason — these companies funnel free cash into R&D, infrastructure, and buybacks rather than dividends. If income is your goal, telecom, energy, financials, and REITs are typically the better fit.
Revenue trend — Amazon's dominant scale, NVIDIA's vertical climb
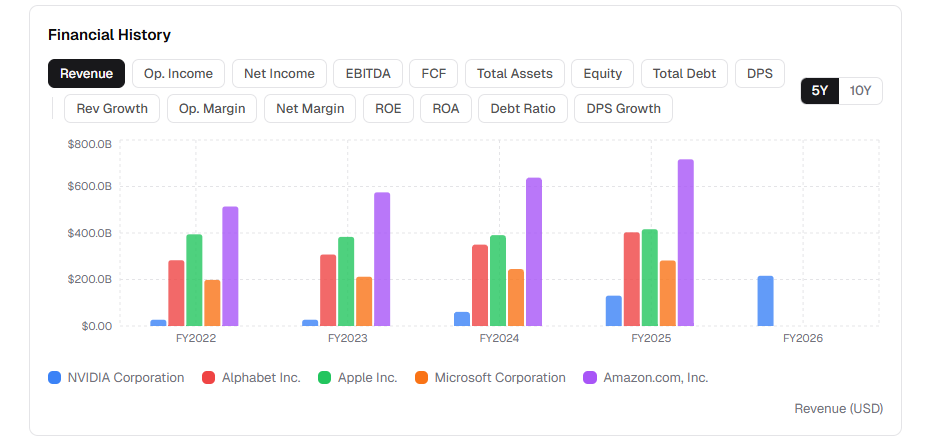
Two patterns jump out from the revenue time series. First, Amazon is the largest by revenue across every period, hitting $716.92B in FY2025 — well ahead of #2 Apple at $416.16B. Second, NVIDIA was the smallest in FY2022–2023, then inflects almost vertically from FY2024 onward. AI data center demand rewrote the company's scale in a span of two years — visible directly in the data.
Alphabet and Microsoft show steady growth. Apple has the largest absolute revenue but the slowest growth, at +10.07%.
Try it yourself
The compare feature is free for everyone, no login required. Plug in your own list of stocks and you'll see returns, metrics, and financial trends on a single page.
Have a stock combination you'd like analyzed, or a metric you wish were included? Feedback is always welcome.