A practical guide to KOSPI & KOSDAQ rankings, with live data sources.
If you've been watching the AI semiconductor cycle, you've probably noticed Korean names appearing more often in global market-cap conversations. The two giants — Samsung Electronics and SK hynix — supply the high-bandwidth memory (HBM) chips that power NVIDIA's data-center GPUs, and that exposure has pulled Korea back into the global spotlight.
But finding good, English-language data on Korean stocks is harder than it should be. Most Korean financial portals are Korean-only, and US-focused screeners often skip KOSPI and KOSDAQ entirely. This post walks through how I track Korea market cap rankings as a non-Korean investor — and shares the live resource I built to fill that gap.
The largest Korean companies right now
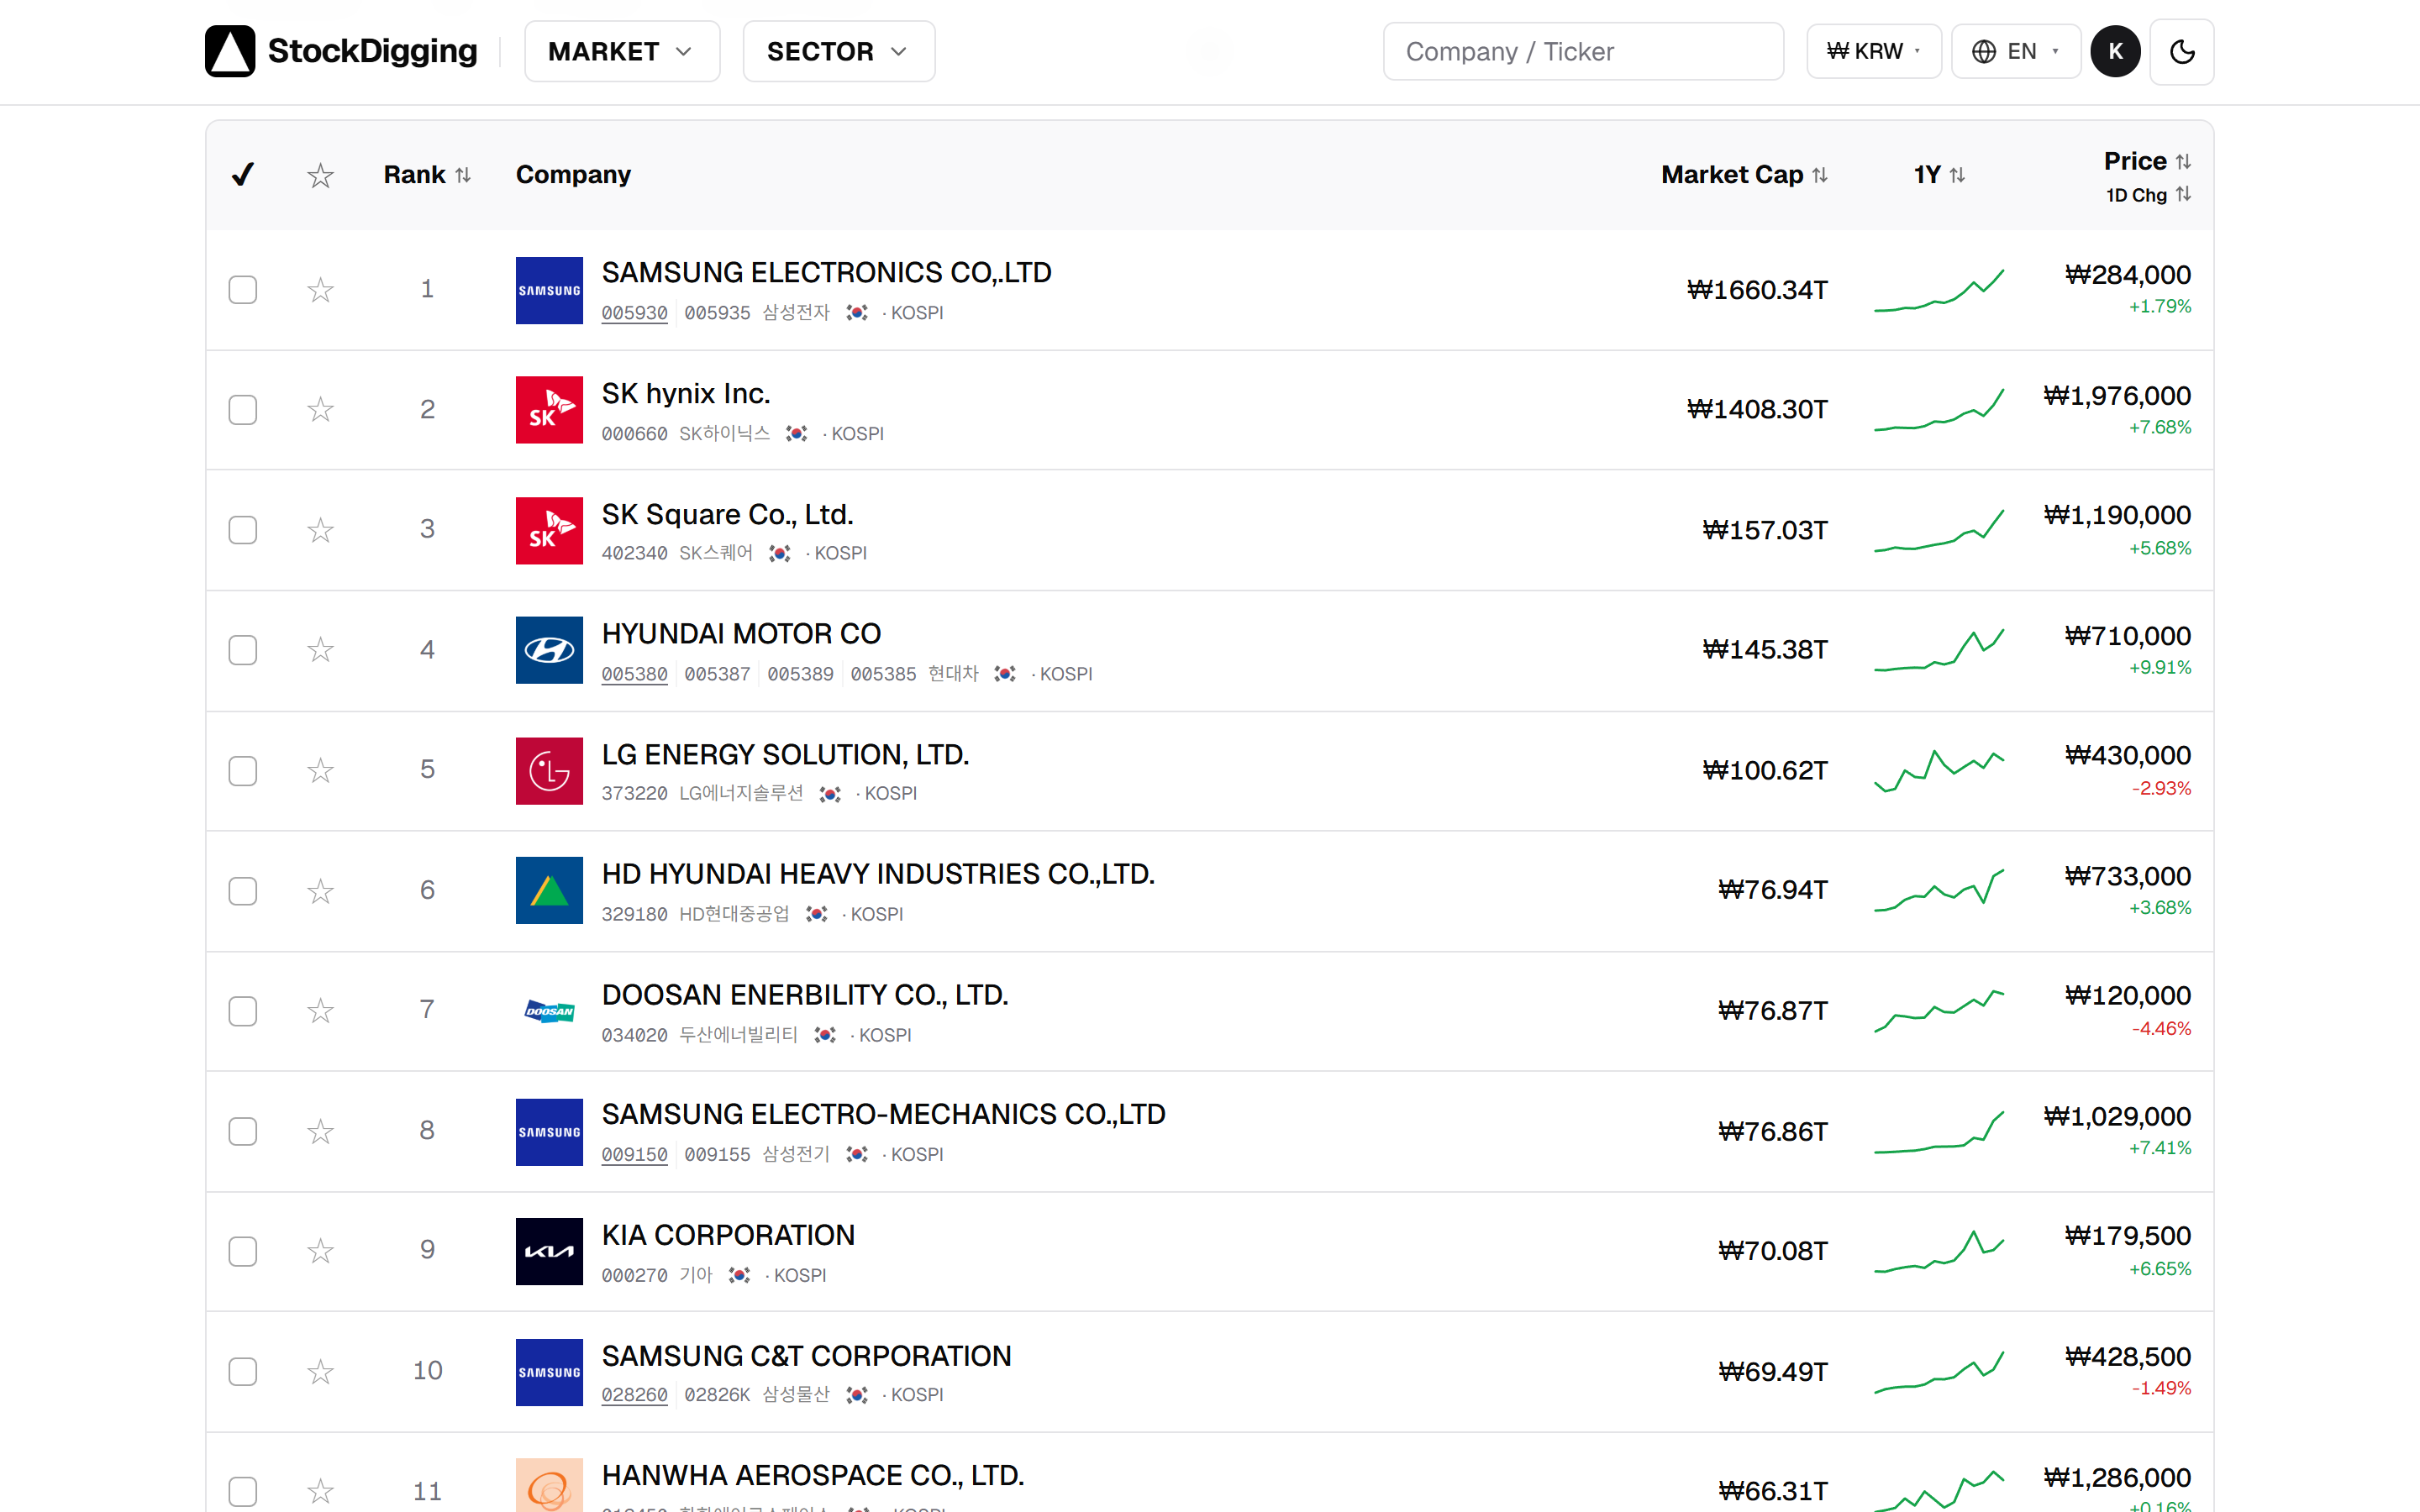
As of May 13, 2026, the top 5 KOSPI companies by market capitalization are:
- Samsung Electronics (005930) — global leader in memory chips, smartphones, and displays
- SK hynix (000660) — pure-play memory specialist, HBM market share leader
- SK Square(402340) — SK group's holding company for semiconductor and ICT investments
- Hyundai Motor (005380) — automotive group, expanding aggressively into EVs and software-defined vehicles
- LG Energy Solution (373220) — EV battery manufacturer, supplier to Tesla, GM, and others
Live, daily-updated rankings: Korea market cap rankings (KOSPI & KOSDAQ).
These rankings refresh daily after Korean market close. Values are calculated as the day's closing price × shares outstanding, which matches the methodology used by exchanges and major financial data providers.
KOSPI vs KOSDAQ — what's the difference?
Korea has two main exchanges, and the distinction matters for portfolio construction:
- KOSPI(Korea Composite Stock Price Index) — the main board. Hosts the country's largest, most established companies. Samsung, SK hynix, Hyundai, POSCO, KB Financial all trade here.
- KOSDAQ— the growth-oriented secondary market. Much smaller than KOSPI (roughly one-tenth the total market cap), more tech and biotech-heavy, higher volatility, more retail-driven. It's sometimes loosely compared to NASDAQ for its tech tilt, but the size comparison doesn't hold — NASDAQ rivals NYSE in total market cap, while KOSDAQ is a small fraction of KOSPI.
When people say "Korean stocks," they usually mean KOSPI by default. KOSDAQ is where you go hunting for smaller, higher-growth names.
Beyond market cap — what else to look at
Market cap tells you size, not value. The same screener ranks the same KOSPI + KOSDAQ universe by a wide range of other metrics — valuation, profitability, growth, balance sheet, dividend, price performance, and trading activity. Sorting on any of them re-orders the table in place.
A few I check most often (examples, not the complete list):
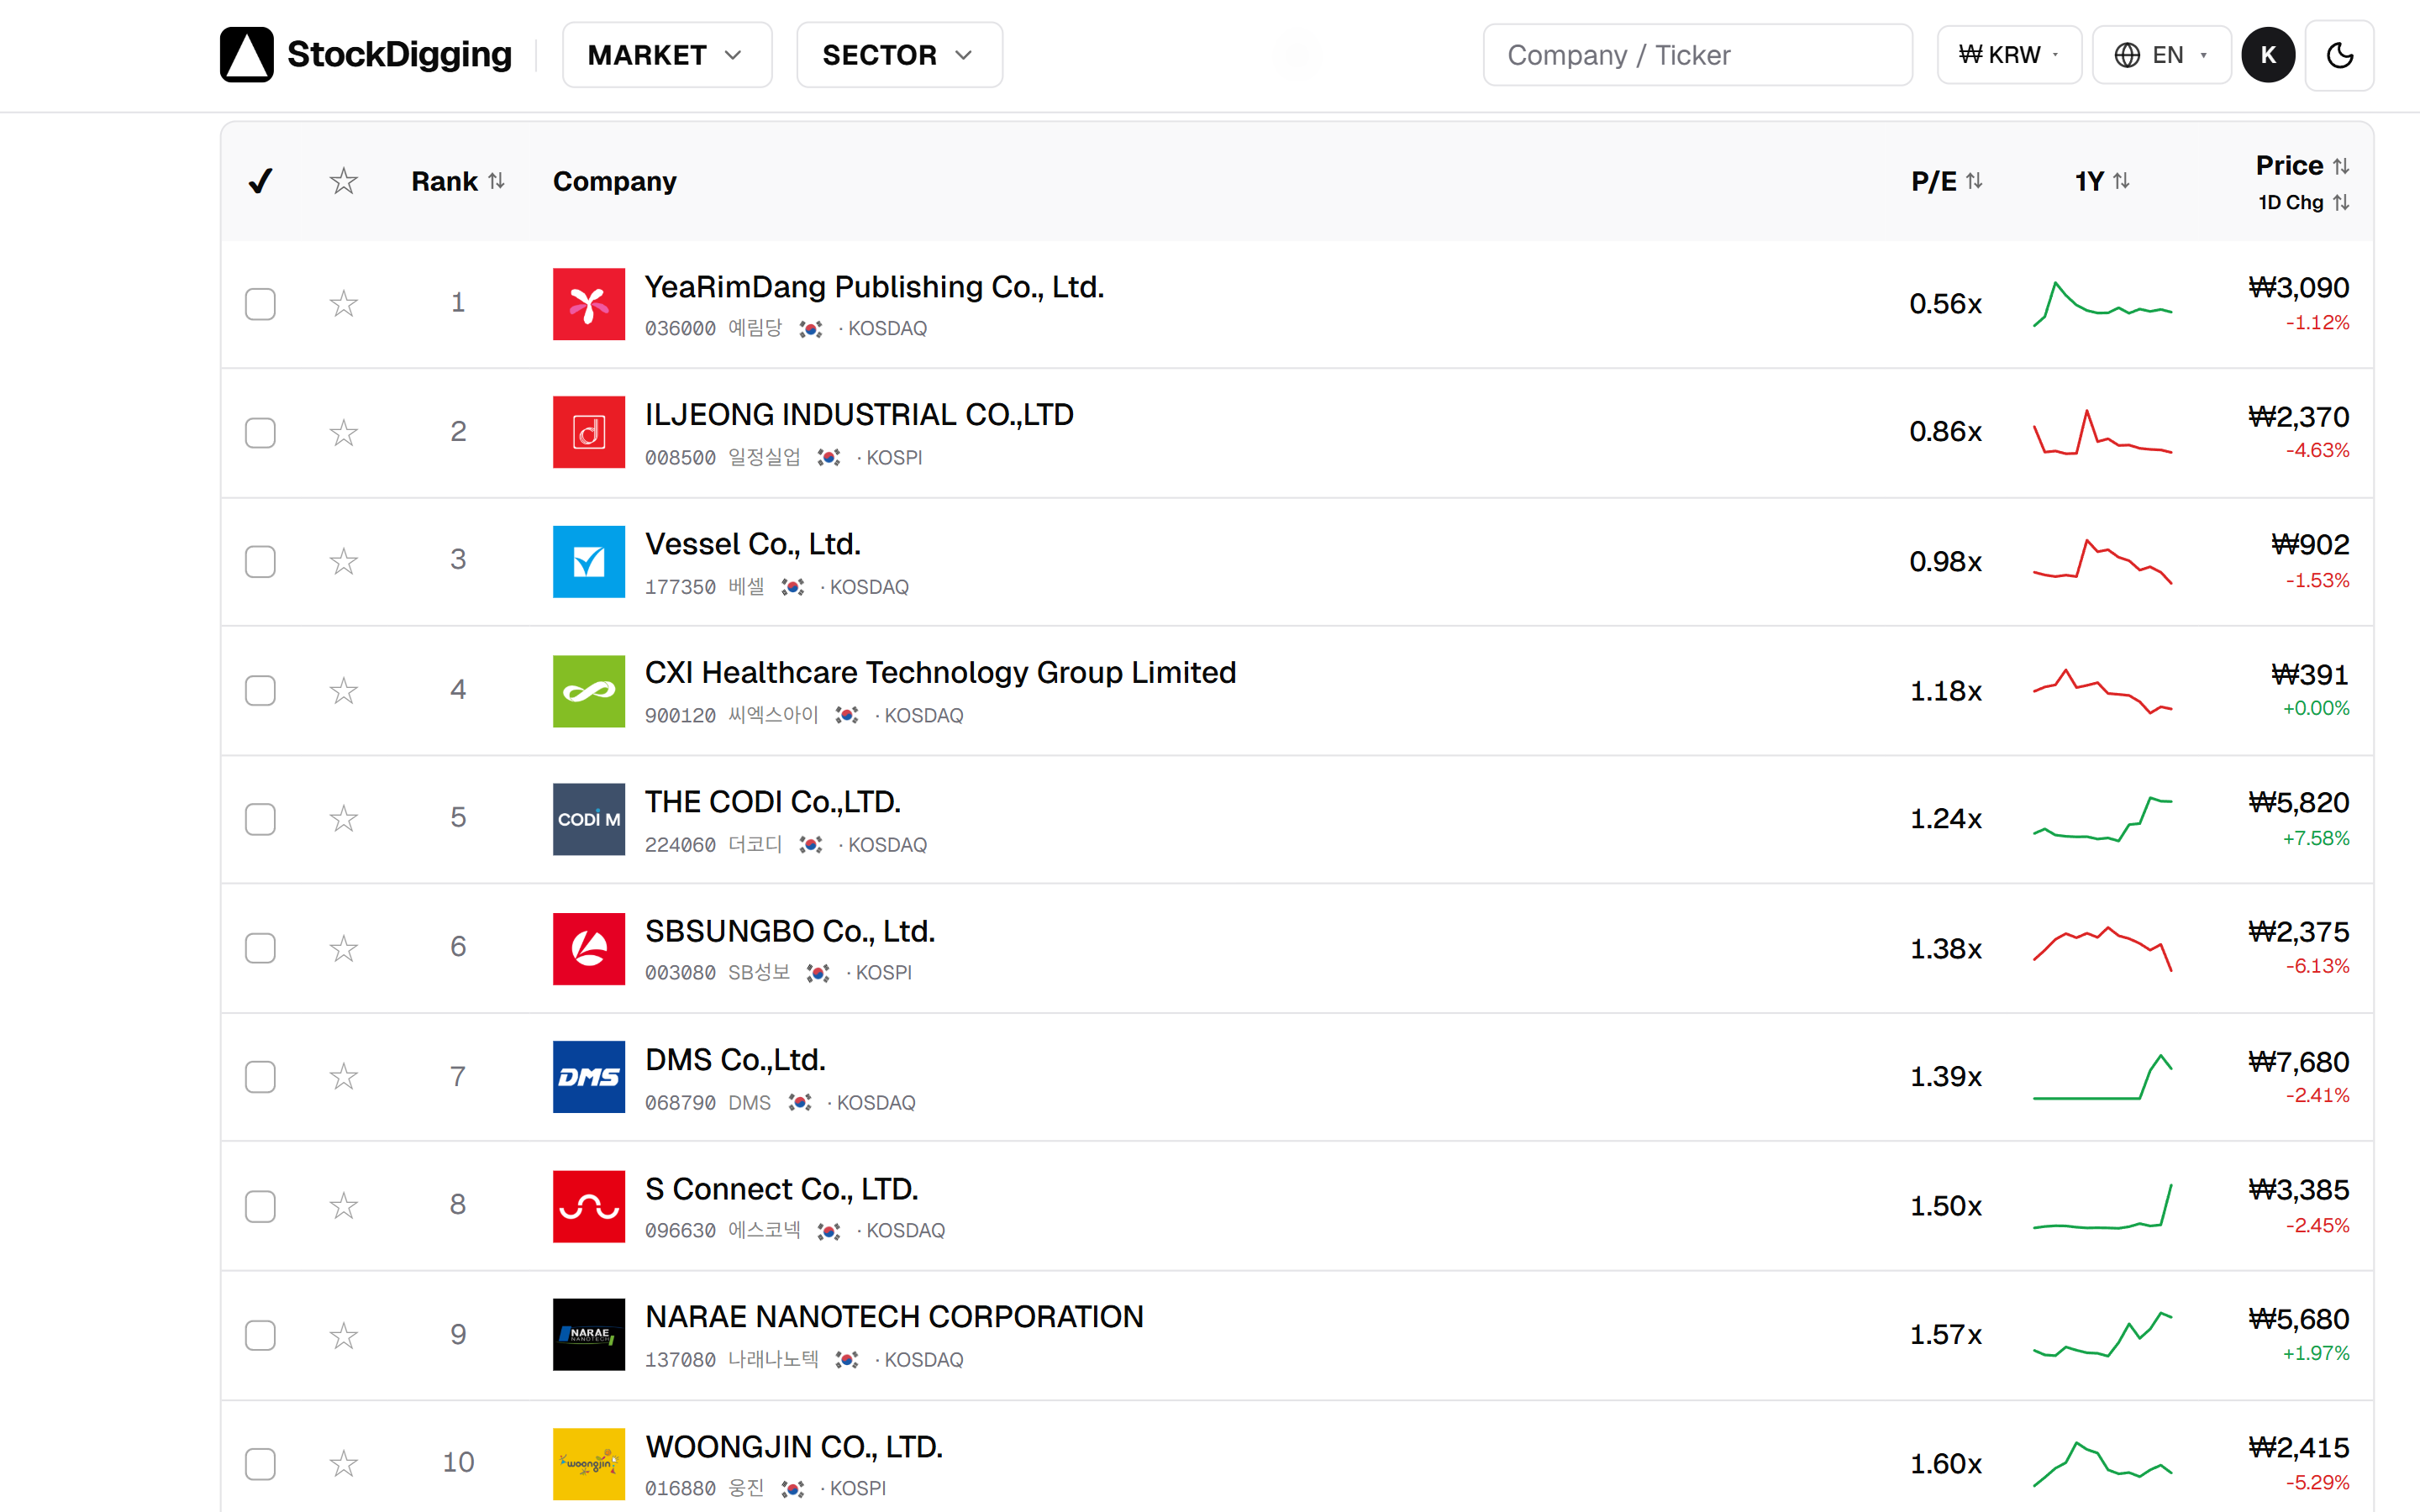
- P/E ratio— how the market is pricing earnings. Korean blue chips have historically traded at lower P/Es than US comparables (the "Korea discount"). Live: Korean stocks with lowest P/E ratio.
- Dividend yield— Korean dividend culture has been improving since the government's "Value-Up" reforms. Live: Korean dividend stocks (highest yield).
- ROE — capital efficiency. Korean conglomerates (chaebol) have historically been criticized for sprawling, low-ROE structures. Live: Korean stocks with highest ROE.
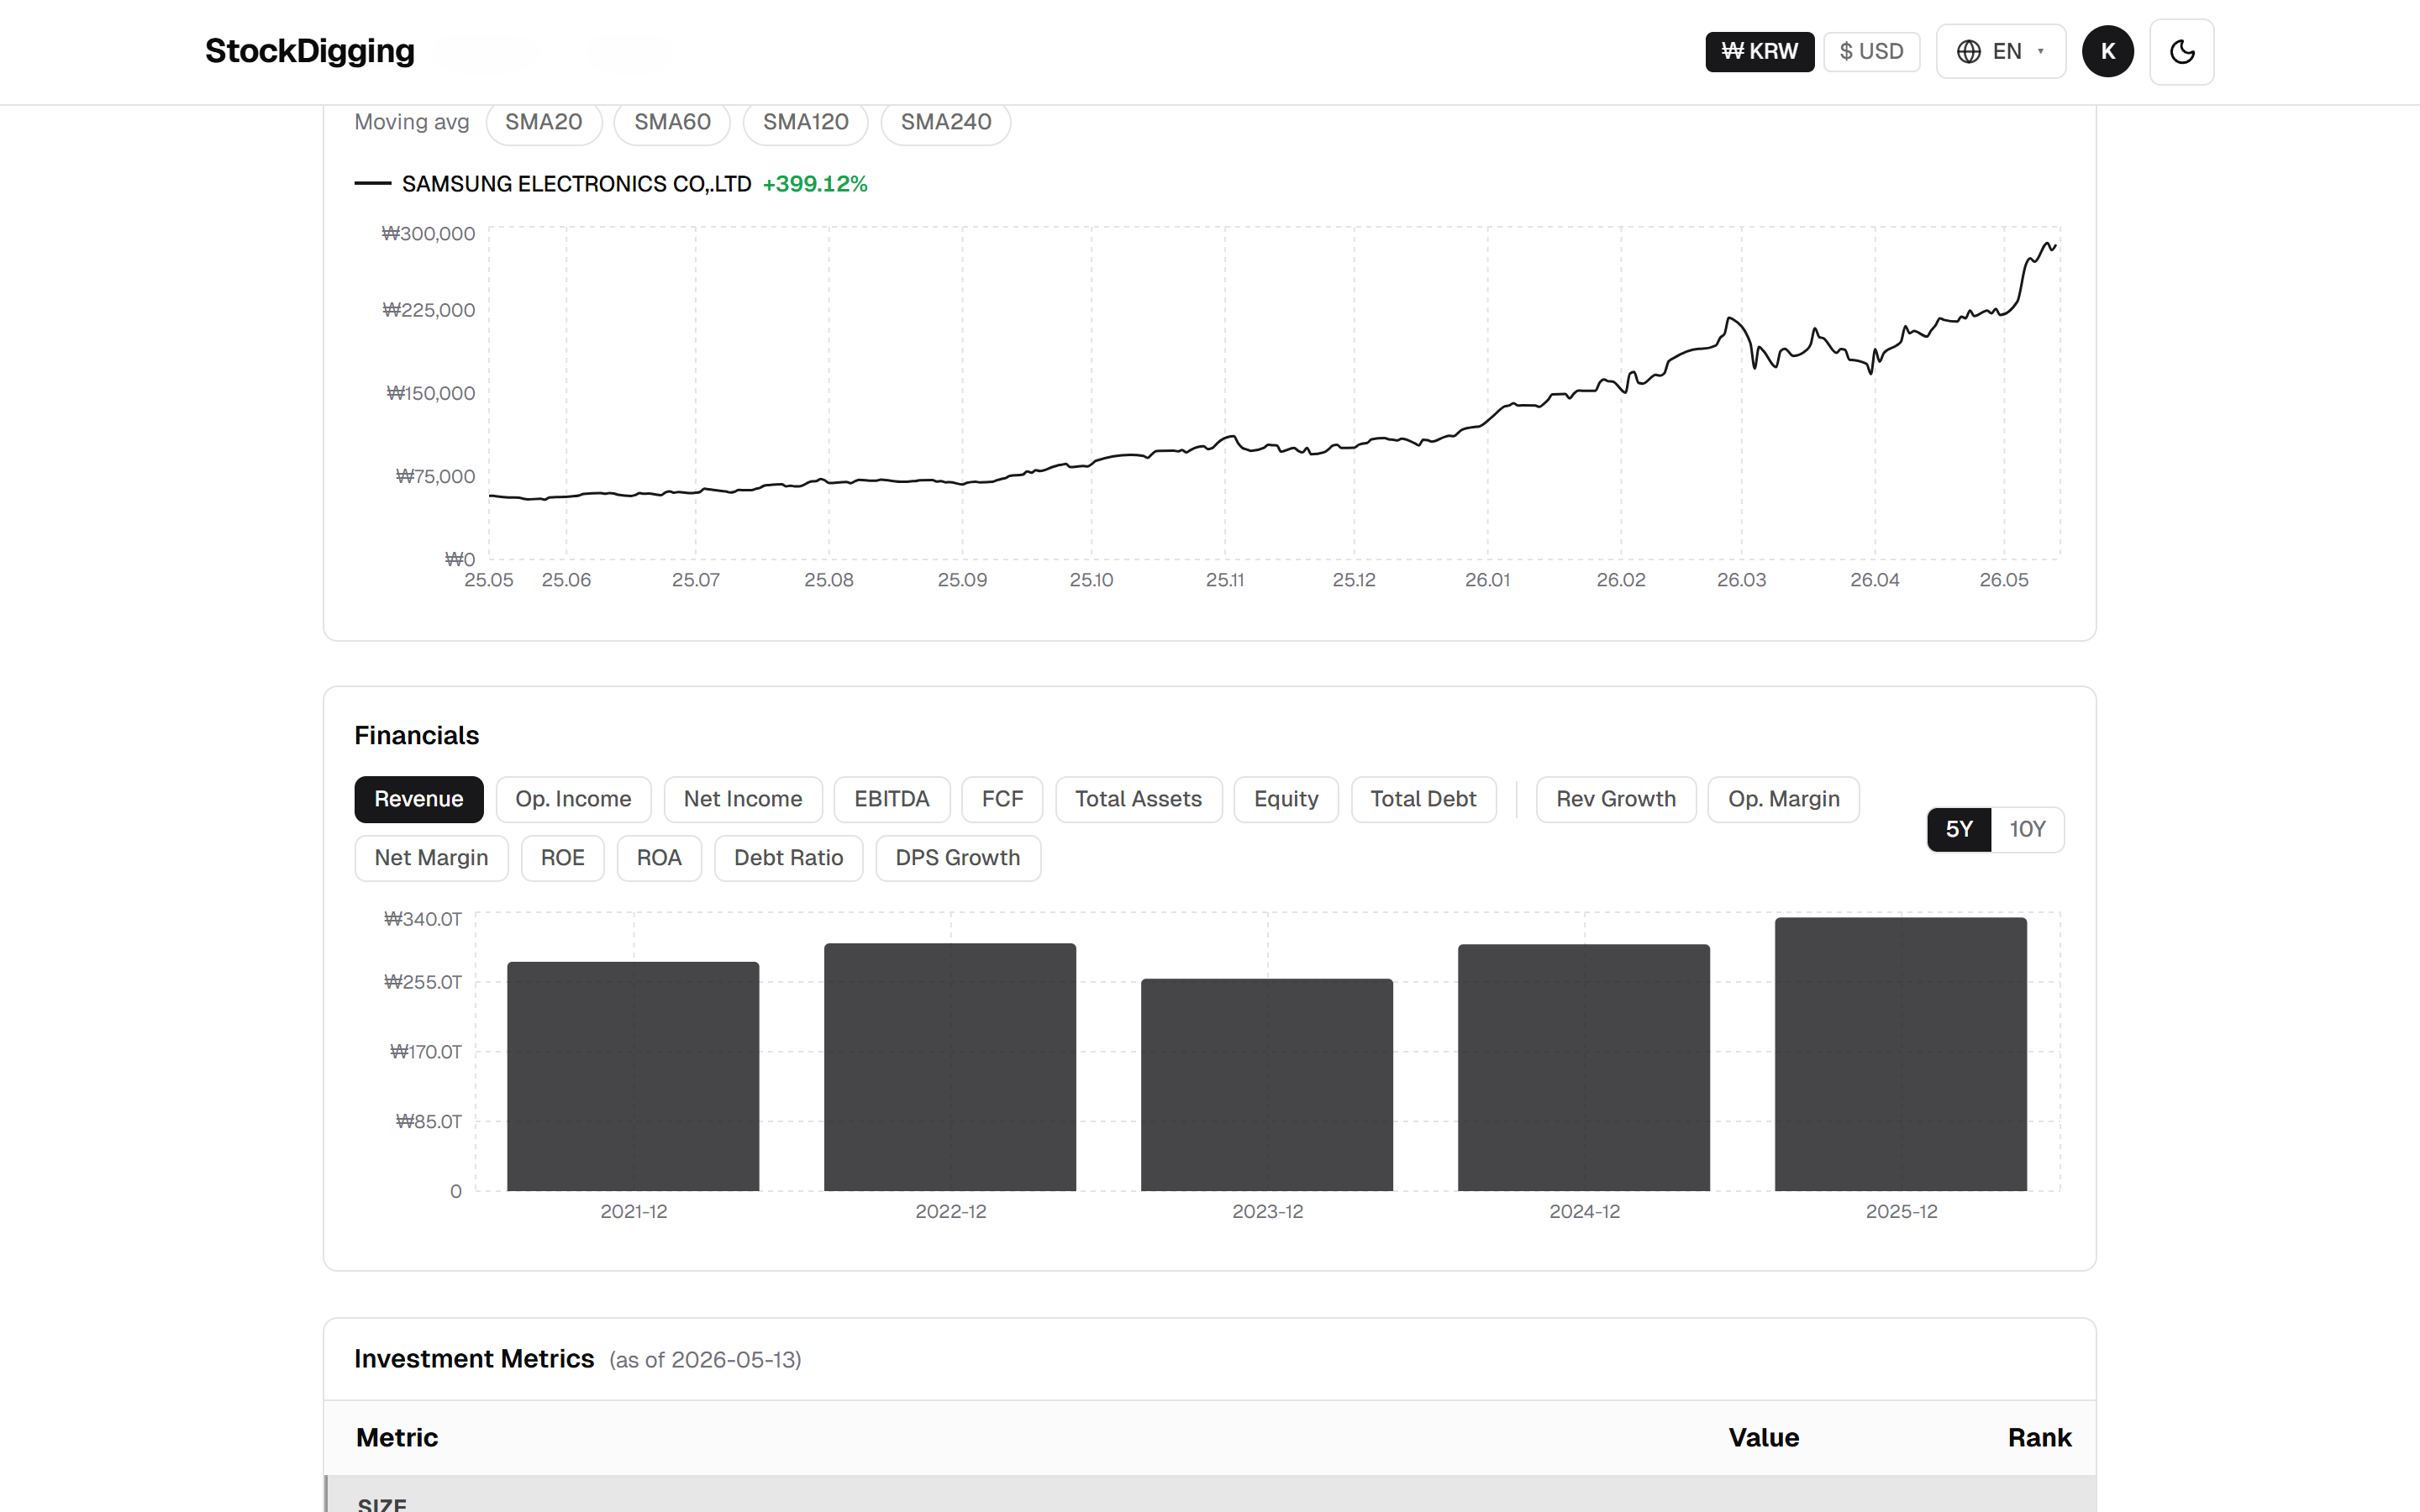
Other metrics the screener tracks (not linked above): P/B, PEG, P/S, EV/EBITDA, FCF yield, operating margin, revenue, net income, free cash flow, revenue growth, dividend growth, total assets, total equity, total debt, cash on hand, current ratio, debt ratio, net debt/EBITDA, 1-day / 30-day / 1-year price returns, max drawdown, volume, trading value, employees, and (for Korea only) foreign ownership ratio. Any of them can sort or filter the same universe.
A note on data quality
Korean stock data in English has some traps:
- Market cap in won, not USD. Most local sources report market cap in 조원 (trillions of won). You need to apply the daily USD/KRW rate to compare against US peers. A trillion won is roughly $670M at ₩1,500/USD.
- Stock splits. Samsung Electronics did a 50:1 split in 2018. Some legacy data sources still serve pre-split historical prices, which makes long-term charts useless. Always verify the source adjusts for splits.
- ADRs vs primary listings. Some Korean names (KEPCO, POSCO) historically had US ADRs that have since delisted. The primary KOSPI/KOSDAQ listing is the right reference.
Bottom line
If you want to follow Korean stocks seriously as a non-Korean investor, the workflow that worked for me is:
- Start from the Korea market cap rankings for the universe.
- Filter by sector and exchange (KOSPI vs KOSDAQ) for what you care about.
- Switch the sort to whatever metric matters for your thesis — valuation, quality, income, growth, balance sheet, price performance. Layer range filters on top if you want to narrow further.
- Read the original DART filings (Korea's SEC equivalent) for the names you want to actually own.
Nothing in this post is investment advice. All figures are point-in-time snapshots — live numbers refresh on the linked pages.
Open Korea Market Cap Rankings →
I built StockDigging as the data layer I wished existed when I first started looking at Korean stocks. Free, no signup, daily-updated. KOSPI, KOSDAQ, NYSE, NASDAQ — same screener, same metrics. If you find a metric missing or a number that looks wrong, the contact page is the fastest way to flag it.