1. "How do I find stocks that fit this idea?"
A common question for any stock investor:
- "A high-quality company that's also undervalued and growing"
- "A reliable dividend payer that's not at risk of going bust"
- "A value stock with low P/B and strong equity"
Each of these requires looking at multiple metrics at once. StockDigging makes that one-click via Composite Ranking.
2. How does Composite Ranking work?
The mechanism is simple:
- You pick 2–5 metrics (e.g., ROE, P/E, Revenue Growth)
- Every stock in the market is ranked by each metric individually
- Each stock's rank scores are summed up
- Stocks are sorted by the lowest sum first
Example: Stock A ranks ROE 5th + P/E 12th + Revenue Growth 30th = sum of 47.
Stock B ranks ROE 3rd + P/E 50th + Revenue Growth 8th = sum of 61.
→ A appears above B.
3. Quick Sort — when you don't know which metrics to combine
The strength of Composite Ranking is freedom of metric choice. But that's also its weakness:
"Out of all these metrics, which combination is actually meaningful?"
That's why we added Quick Sort: 6 preset investment lenses, each auto-selecting 5 metrics with one click.
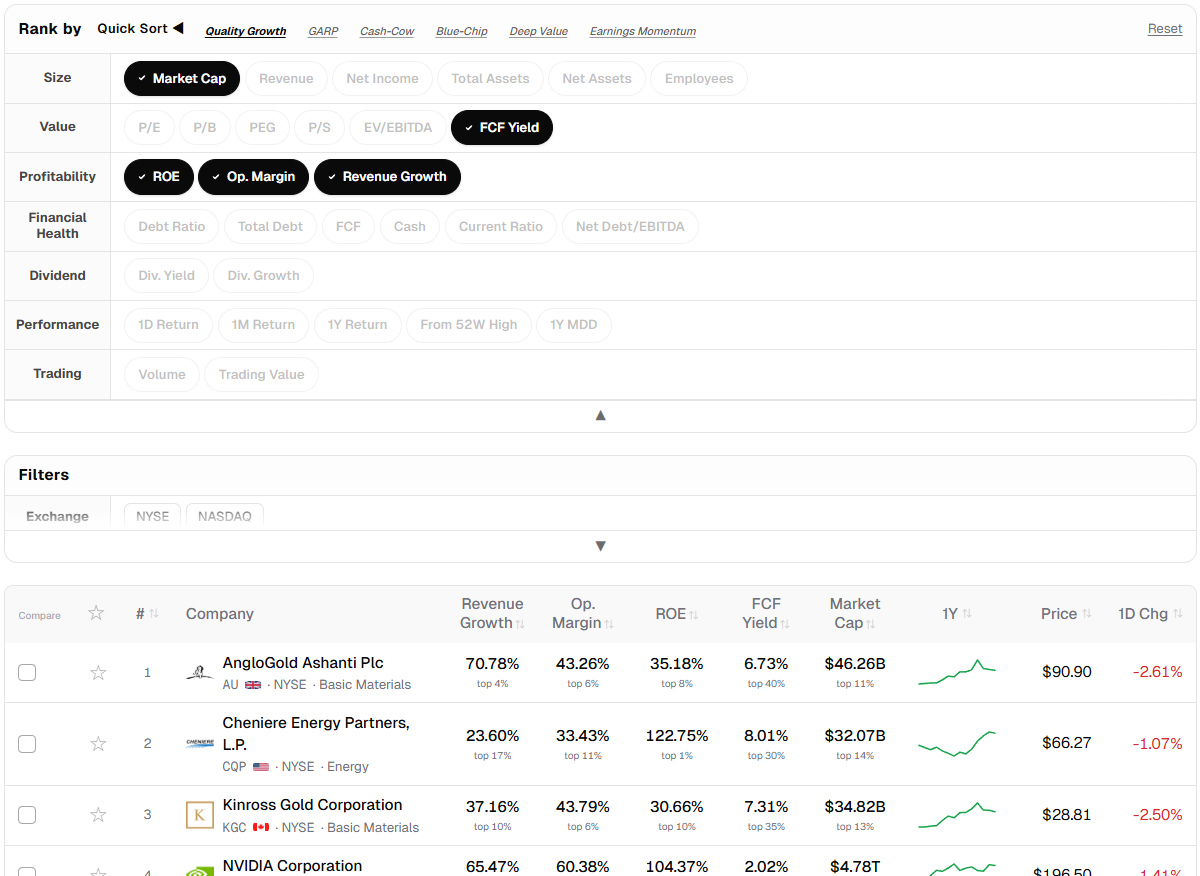
Important: these 6 are not "answers" — they're starting points. Begin with a preset and customize from there by adding or removing metrics.
3-1. Quality Growth
Lens: sustainable alpha through high entry barriers and operational efficiency
| Metric | What it captures |
|---|---|
| Revenue Growth | Scalability of the business model |
| Op Margin | Cost-structure efficiency + pricing power |
| ROE | Profit generation per unit of equity |
| FCF Yield | Real cash conversion of accounting earnings |
| EV/EBITDA | Enterprise value multiple of operating cash generation (debt-inclusive) |
Looks for stocks satisfying revenue growth + margin + capital efficiency without being overpriced on a debt-inclusive valuation multiple.
3-2. GARP (Growth at a Reasonable Price)
Lens: balance between growth and value metrics
| Metric | What it captures |
|---|---|
| P/E | Price relative to earnings (valuation anchor) |
| Revenue Growth | Top-line expansion driver |
| Op Margin | Margin level that determines growth quality |
| ROE | Growth sustainability via capital efficiency |
| Debt Ratio | Financial leverage discipline |
Find growth stocks without overpaying — businesses where revenue growth is accompanied by strong margins and capital efficiency, acquired at a reasonable multiple without excessive leverage.
3-3. Cash-Cow
Lens: sustainable shareholder return based on robust cash generation
| Metric | What it captures |
|---|---|
| Dividend Yield | Direct measure of cash inflow vs. principal |
| FCF Yield | Self-sustaining dividend payment capacity |
| ROE | Underlying basis for dividend capacity |
| Net Debt/EBITDA | Debt servicing ability |
| Trading Value | Market liquidity (ease of entry/exit) |
Targets sustainable dividends, not just high-yield outliers.
3-4. Blue-Chip
Lens: market dominance + financial soundness
| Metric | What it captures |
|---|---|
| Market Cap | Firm size |
| Net Income | Absolute earnings scale |
| Op Margin | Competitive edge (margin level) |
| Debt Ratio | Capital structure stability |
| ROE | Capital efficiency retained at maturity |
For investors who prefer large-cap stability over high-volatility plays.
3-5. Deep Value
Lens: extreme undervaluation vs. liquidation/intrinsic value
| Metric | What it captures |
|---|---|
| P/B | Price relative to book net assets |
| Total Equity | Base capital scale |
| Current Ratio | Short-term debt coverage |
| Net Debt/EBITDA | Insolvency risk filter |
| ROE | Minimum profitability to dodge value traps |
Benjamin Graham-style value investing. The point is filtering out value traps via Current Ratio + ROE.
3-6. Earnings Momentum
Lens: synchronized earnings improvement and price trends
| Metric | What it captures |
|---|---|
| From 52W High | Trend strength (proximity to highs) |
| 30D Return | Short-term capital inflow velocity |
| Revenue Growth | Business expansion supporting price action |
| Net Income | Qualitative earnings growth |
| ROE | Capital efficiency acceleration |
Not pure chart momentum — looks for stocks where fundamentals and price are moving together.
4. Customize — from preset to your own style
The 6 Quick Sort presets are just starting points.
- Drop Market Cap if size doesn't matter to you, swap in another metric
- Replace Debt Ratio with Net Debt/EBITDA
- Add Dividend Yield to build a "growth + dividend" hybrid
Metric chips toggle on a single click. Adjust freely on the same screen.
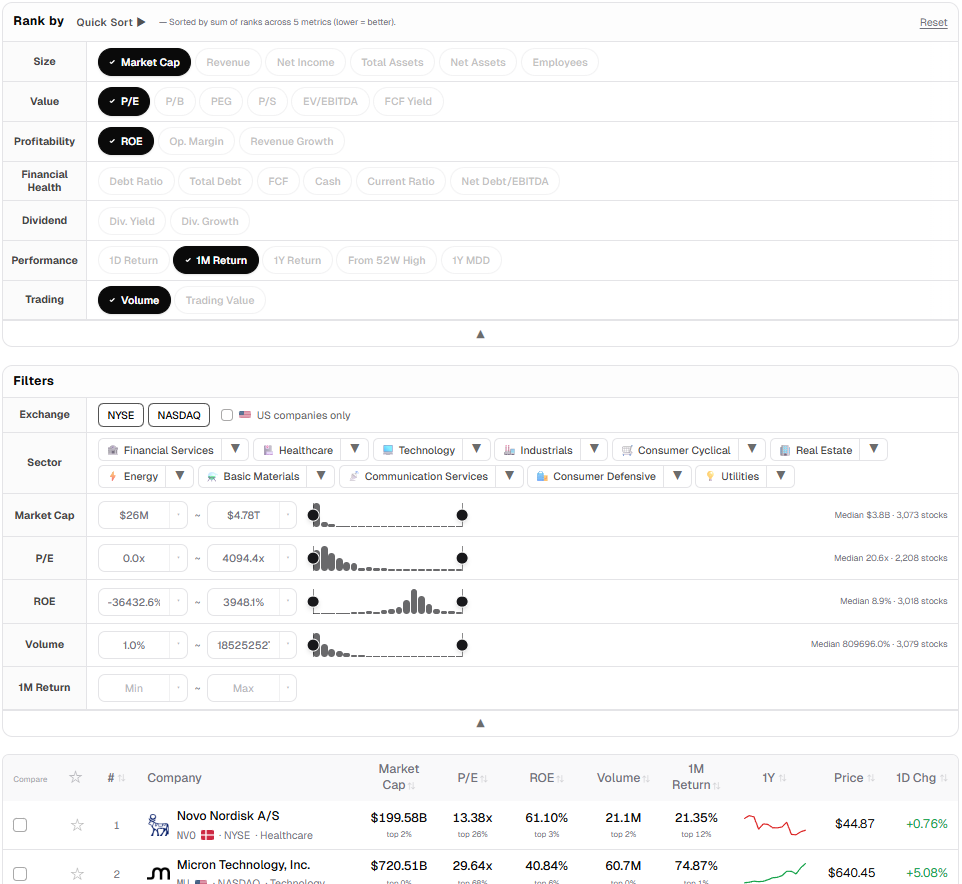
Composite Ranking also pairs with range filters.
Example: narrow down candidates with "P/E between 5 and 15 + ROE ≥ 10%", then sort that subset by your composite ranking.
5. Once more — sorting is not recommending
- StockDigging does not provide price targets
- StockDigging does not give buy/sell calls
- The 6 Quick Sort strategies are not "the right answer"
- Composite Ranking results are not a recommendation list
The tool does exactly one thing: processes market data and presents it through your chosen lens.
6. Try it yourself
Open the StockDigging home page and click the "Quick Sort" button above the sort chips. Pick one of the 6 presets, see the result, then adjust to your own taste.
Got feedback or a preset you'd like to see? Let me know.